L'analyse de l'enquête est le processus d'analyse des données/réactions des clients recueillies à partir des questionnaires que nous avons précédemment menés.
La plupart des outils de création d'enquêtes fournissent des options pour générer les réponses, mais il faut plus qu'un sous-ensemble de répondants et des pourcentages bien rangés dans un tableau pour donner un sens à l'information.
Dans cet article, nous vous donnons un exemple pratique de la manière d'organiser, d'analyser et d'utiliser des informations exploitables pour faire avancer votre entreprise et satisfaire toutes les parties prenantes de l'entreprise.
Plongeons dans le vif du sujet.
9 étapes pour analyser les résultats d'une enquête :
- Mise en place d'un formulaire d'enquête pour faciliter la collecte des données
- Organiser les données d'enquête collectées
- Utiliser la méthode d'analyse des données d'enquête
- Créer des personas basés sur des données démographiques
- Créer un contenu basé sur des données
- Déterminer les meilleurs canaux de distribution
- Déterminer la stratégie de marketing des médias sociaux
- Amélioration des produits
- Prédire le comportement futur
1. Configurez votre formulaire d'enquête pour faciliter la collecte des données
Pour faciliter la compréhension de l'ensemble du processus d'analyse des données, nous prendrons l'exemple d'un modèle de restaurant simple.
Cette enquête en ligne contient principalement des questions à choix multiples et des questions fermées sur la nourriture, le personnel, le prix, l'âge et les plateformes de médias sociaux que les clients utilisent pour nous trouver.
Ces types de questions sont plus faciles à analyser et permettent d'obtenir un taux de réponse plus élevé.
Néanmoins, l'enquête comprend des questions ouvertes qui peuvent nous aider à recueillir des informations plus pertinentes auprès des clients.
L'enquête devrait nous permettre de mieux comprendre les besoins de notre public cible.
Cependant, les exemples de cas d'utilisation présentés dans cet article de blog devraient vous permettre de comprendre l'utilisation possible des données obtenues à partir de n'importe quelle enquête de retour d'information, comme par exemple les enquêtes d'études de marché.
2. Organiser les données de l'enquête
Une fois le processus de collecte des données terminé, la première étape consiste à exporter les données de l'outil d'enquête vers Google Sheets, Excel ou toute autre application d'analyse statistique.
Si vous disposez déjà de vos données, vous pouvez sauter cette partie et passer directement à l'analyse des données de l'enquête.
Après avoir exporté l'enquête, les données devraient ressembler à ceci :
Ensuite, nous devons diviser le tableau en groupes plus généraux afin de ne pas nous perdre dans la liste des questions.
En voici un exemple :
- Démographies
- Marketing: Âge : Comment avez-vous entendu parler de nous ?
- Personnel: Le personnel vous a-t-il semblé accueillant et sympathique ?
- Alimentation: Comment évaluez-vous la qualité de la nourriture dans notre restaurant ? Les plats sont-ils arrivés à temps ?
- Menu: Y a-t-il quelque chose qui, selon vous, devrait figurer sur le menu ?
- Prix: Les prix étaient-ils à la hauteur de la qualité de votre expérience ?
- NPS (Net promoter score): Quelle est la probabilité que vous recommandiez le restaurant à vos amis ?
- Retour: Viendrez-vous nous rendre visite à nouveau ?
Une fois les chiffres en place, l'étape suivante consiste à calculer le pourcentage afin de comparer rapidement les réponses.
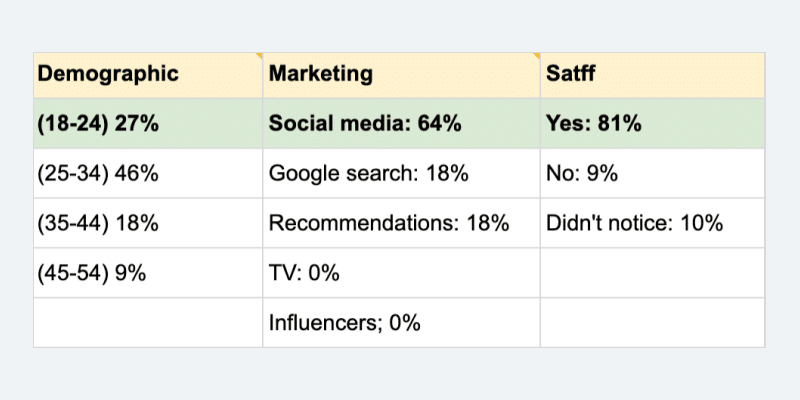
Voici un exemple de calcul du pourcentage par groupe d'âge :
Pour déterminer le groupe d'âge qui vient le plus dans notre restaurant, nous devons diviser le nombre total de personnes dans chaque groupe d'âge par le nombre total de réponses à l'enquête, multiplié par 100.
Pour ce faire, nous retiendrons la tranche d'âge 25-34 ans.
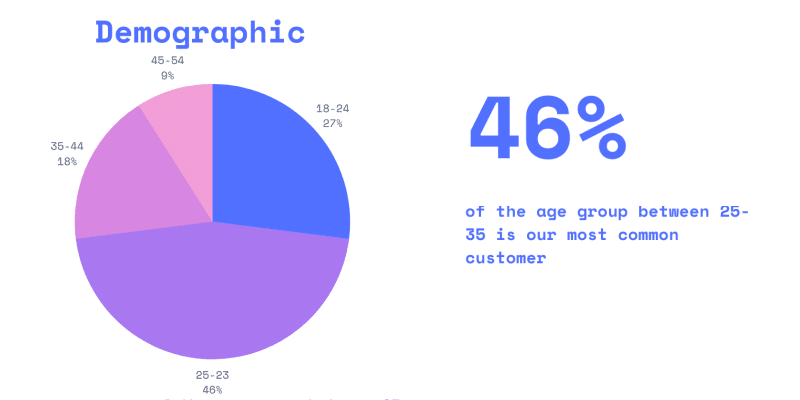
- 25 personnes âgées de 25 à 34 ans ont répondu à notre enquête
- Le nombre total de personnes ayant répondu à l'enquête est de 55.
- 25/55 × 100 = 461 TP3T
- 46% des clients qui ont visité notre restaurant appartiennent à la tranche d'âge 25-34 ans.
3. Utiliser des méthodes d'analyse des données d'enquête
Il est maintenant temps de donner un sens aux données quantitatives et qualitatives que nous avons recueillies dans le cadre de l'enquête.
Pour ce faire, nous utiliserons plusieurs méthodes simples telles que l'examen de nos principales questions de recherche, le croisement et le filtrage des résultats, et l'analyse comparative des résultats de l'enquête.
Voici ce que cela signifie :
Questions principales
Les meilleures questions de l'enquête devraient nous donner des informations sur le sujet ou le thème qui nous intéresse le plus.
Par exemple, si nous souhaitons améliorer nos méthodes de marketing et de promotion, nos principales questions de recherche seront celles qui se rapportent à la partie marketing :
Comment avez-vous entendu parler de nous ?
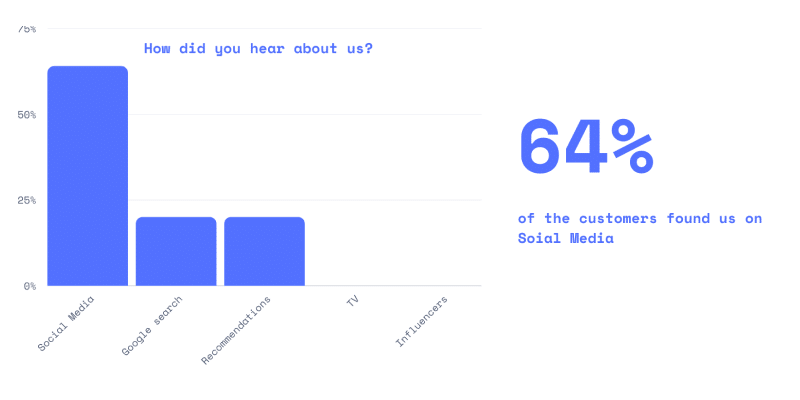
Les données fournies par les répondants sont évidentes. 63% des personnes interrogées ont déclaré avoir entendu parler du restaurant par le biais des médias sociaux. 18% des personnes interrogées ont déclaré nous avoir trouvés sur Google, et les publicités télévisées ainsi que les influenceurs nous ont apporté 0 client.
Ainsi, la première question de recherche n'est rien d'autre qu'un pourcentage des personnes interrogées qui ont donné une réponse spécifique à une question spécifique.
Croisement et filtrage des résultats
Le tableau croisé consiste à comparer les résultats (ensembles de données) entre plusieurs sous-groupes de l'enquête.
Exemple : Nous voulons comparer les réponses des groupes d'âge 18-24 ans et 25-34 ans à la question "Comment avez-vous entendu parler de nous ?".
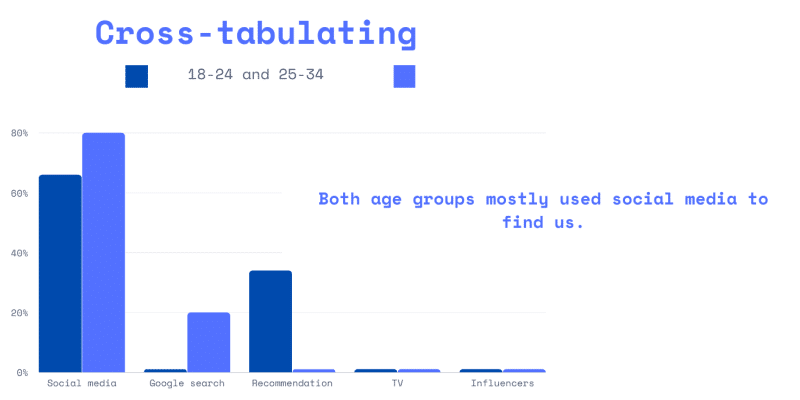
66% des clients âgés de 18 à 24 ans ont répondu qu'ils avaient entendu parler de nous par les médias sociaux, 33% ont répondu qu'ils avaient visité le restaurant après que quelqu'un l'ait recommandé.
Le groupe suivant est celui des 25-34 ans. 80% ont répondu qu'ils avaient entendu parler du restaurant par les médias sociaux, et 20% ont répondu qu'ils l'avaient trouvé sur Google.
Nous pouvons conclure que les deux groupes d'âge sont principalement "venus" par les médias sociaux, mais que le groupe des 25-34 ans a tendance à rechercher des restaurants sur Google, contrairement au groupe des 18-24 ans.
Le filtrage des résultats signifie que nous nous concentrons sur un seul sous-groupe à la fois au lieu de comparer les réponses de plusieurs sous-groupes.
Par exemple, nous ne pouvons analyser que le groupe d'âge des 25-34 ans et n'étudier que leurs réponses à l'enquête.
Données de l'enquête de référence
L'étalonnage consiste à établir une base de référence à partir de laquelle vous pouvez comparer les données de l'enquête A avec les données que vous recueillerez dans le cadre de l'enquête B.
En voici un exemple :
Nous pouvons prendre les données du score NPS de l'enquête A (Quelle est la probabilité que vous nous recommandiez à un membre de votre famille ou à un ami ?) et comparez le score NPS avec les données de l'enquête B.
Le score obtenu lors de notre première enquête (enquête A) constitue notre base de référence.
Si les données de l'enquête A montrent que le score NPS est plus élevé que les données de notre deuxième enquête, l'enquête B, nous devons en comprendre la cause.
Que faisons-nous aujourd'hui qui fait que les gens ne nous recommandent plus autant qu'avant ?
Nous pouvons utiliser différentes méthodes de visualisation des données, comme les diagrammes à barres, pour faciliter les comparaisons.
—
Jusqu'à présent, nous avons recueilli un grand nombre de données précieuses. Sur la base de ces données, nous pouvons tirer des conclusions, examiner comment améliorer la satisfaction des clients et accroître la valeur de l'entreprise.
Suivez les étapes ci-dessous pour vérifier un exemple réel de les cas d'utilisation des données d'enquête : ?
4. Définir un profil d'acheteur

- L'âge
- Revenu
- Intérêts
- Localisation
- Motivations d'achat
Exemple :
James est un étudiant en master de 27 ans. Il est également employé dans une société d'informatique.
Il vient tous les vendredis soirs avec ses amis. Il n'est pas marié et n'a pas d'enfants. Il est très actif sur les médias sociaux. Il habite à proximité du restaurant et gagne $94,700 par an.
Il aime la photographie, les voyages et goûter différents types de nourriture.
Son média social préféré est Instagram, où il partage régulièrement des histoires de cuisine.
Exemple de persona
5. Créer un contenu axé sur les données
D'après les réponses à l'enquête, nos clients sont principalement des Millennials et des membres de la génération Z, ce qui signifie que la stratégie de contenu (quand, pourquoi et quoi poster) doit correspondre aux habitudes de consommation et aux traits de personnalité des personnes appartenant à ces groupes d'âge.
Nous pouvons utiliser les données de l'enquête pour déterminer le sujet, l'angle et l'objectif afin de créer un contenu plus pertinent et plus attrayant.
Voici quelques exemples de traits de caractère qui décrivent le mieux les clients âgés de 18 à 34 ans.
Faire des recherches avant d'acheter
La génération du millénaire est notoirement difficile à satisfaire, et bien que de nombreux restaurants fassent de leur mieux pour attirer ce groupe démographique avec des rénovations coûteuses ou de nouveaux menus, la façon la plus simple de rendre un restaurant attrayant pour les millénaires pourrait être aussi simple que de générer des commentaires. La reprise des commentaires sur vos profils de médias sociaux ou sur votre site web devrait faire partie de votre stratégie de marketing.
Par ailleurs, si nous reprenons les résultats de notre enquête, nous constatons que 33% des personnes âgées de 18 à 24 ans ont répondu que quelqu'un leur avait recommandé votre restaurant.
Cela signifie que le restaurant fait du bon travail et nous montre que le bouche-à-oreille incite les gens à venir dans votre restaurant.
Peur de manquer quelque chose
Une autre caractéristique qui distingue les acheteurs de ces groupes d'âge est la peur de manquer quelque chose.
Vous pouvez utiliser des critiques et des témoignages, des remises avec compte à rebours ou des copies d'occasions manquées.
Consommateurs visuels
La publication de vidéos, d'images, de GIFS et de MEMEs, voire de contenus interactifs, doit faire partie de votre marketing de contenu.
Consommateurs multi-appareils.
Tout ce que vous allez produire comme contenu doit être optimisé pour plusieurs écrans.
Expressions linguistiques
Les copies que nous rédigeons doivent être destinées au grand public et compréhensibles par tous.
Ton de la voix
Langage amical et décontracté
Créatifs
La plupart des clients sont des jeunes, ce qui signifie que les spécialistes du marketing doivent également concevoir leurs créations (images) en fonction de leurs clients.
6. Déterminer les meilleurs canaux de distribution

Selon les résultats de l'enquête, 63% des personnes interrogées ont entendu parler du restaurant par les médias sociaux. 18% ont effectué une recherche sur Google, 18% ont visité le restaurant sur la recommandation de quelqu'un, et les publicités télévisées et les influenceurs nous ont amené 0 personne.
Nous pouvons en conclure que les médias sociaux et Google devraient être notre priorité pour promouvoir le restaurant et que nous devrions renoncer à la télévision et aux influenceurs.
7. Déterminer la stratégie de marketing des médias sociaux
Les données d'enquête que nous avons recueillies peuvent également être utilisées dans le cadre de nos activités rémunérées. marketing des médias sociaux pour un ciblage plus précis de l'audience.
Voici quelques exemples d'utilisation des données :
- Nous pouvons utiliser les adresses électroniques pour recibler les audiences et créer des audiences similaires basées sur les listes de clients.
- Ajustez la tranche d'âge des annonces, afin de cibler les bonnes audiences et d'économiser du temps et de l'argent pour les tests basés sur les données démographiques.
- Nous pouvons utiliser la liste des clients pour les informer des nouveaux produits proposés dans le menu.
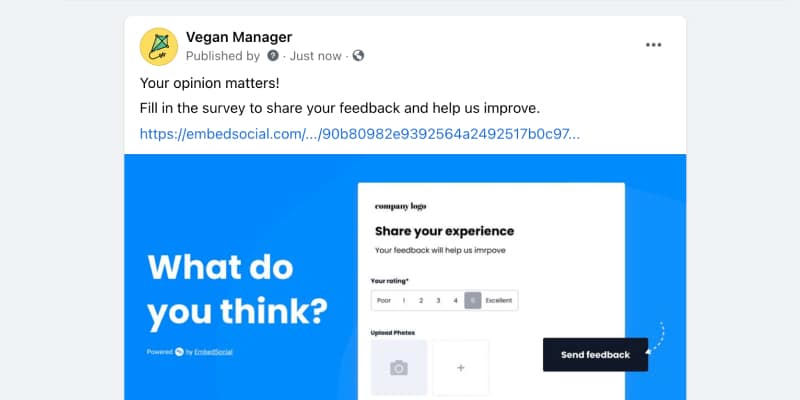
- Nous pouvons cibler des publics froids en fonction de leur intérêt pour la nourriture végétalienne (d'après les données qualitatives des questions ouvertes, la plupart des personnes interrogées aimeraient que des pizzas végétaliennes figurent au menu).
- En connaissant notre persona de client idéal, nous pouvons ajuster correctement notre budget sur Instagram ou Facebook.
- Utilisez des questions d'évaluation pour accroître la pertinence des textes publicitaires.
8. Apporter des améliorations sur la base du retour d'information
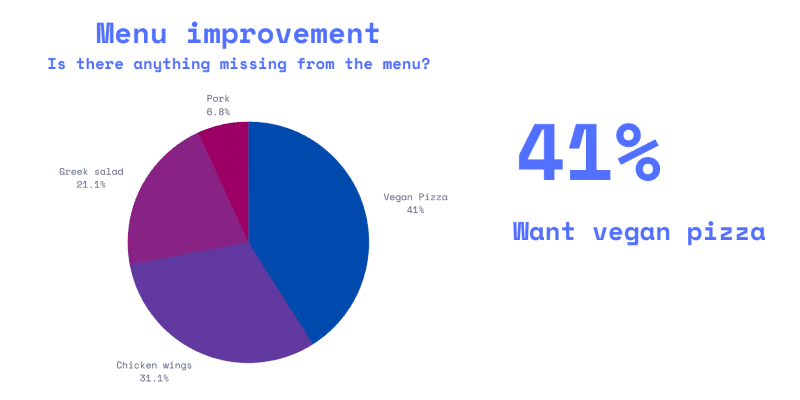
Les résultats de l'enquête montrent que la pizza végétalienne, les ailes de poulet et la salade grecque sont des aliments qui manquent au menu.
Les données nous indiquent que de nombreux visiteurs sont végétaliens et que le restaurant doit envisager des options végétaliennes, comme la pizza végétalienne, pour ses clients.
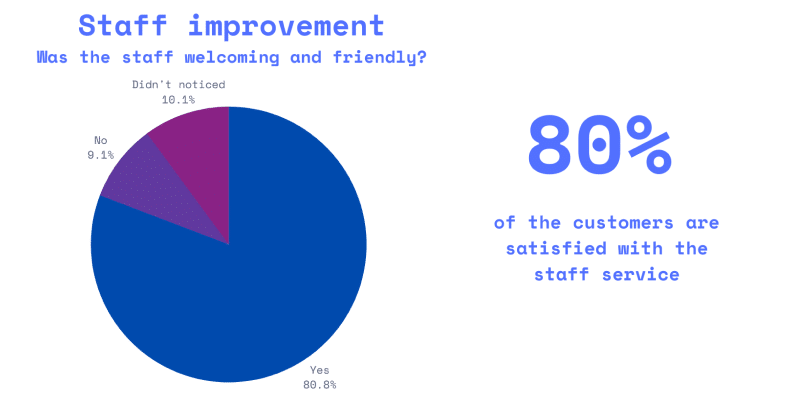
81% des clients ont déclaré que le personnel était aimable, 9% qu'il ne l'était pas et 10% n'ont rien remarqué. Cela signifie que l'équipe fait un bon travail la plupart du temps lorsqu'elle sert les clients.
9. Prédire les comportements futurs
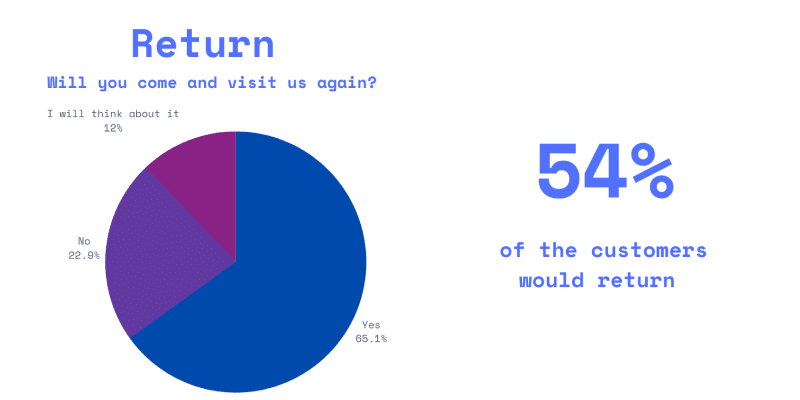
54% des personnes interrogées ont déclaré qu'elles reviendraient, 27% qu'elles ne savaient pas et 19% qu'elles ne reviendraient pas.
La plupart des clients ont déclaré qu'ils reviendraient, ce qui est fantastique, mais examinons les raisons pour lesquelles les clients ne sont pas sûrs de revenir au restaurant en utilisant la méthode des tableaux croisés.
27% a répondu qu'il ne savait pas s'il reviendrait au restaurant.
La logique voudrait que l'on compare ces réponses à celles concernant le prix, la qualité de la nourriture ou l'amabilité du personnel en tant qu'éléments susceptibles d'influencer l'expérience du client.
Voici donc ce que nous avons : ⬇️
60% des personnes ayant répondu "Je ne sais pas" ont également déclaré que le prix ne correspondait pas à la qualité du restaurant. Cela peut donc être une raison pour laquelle une personne réfléchit à deux fois avant de venir au restaurant.
Ceci étant dit, nous pouvons utiliser ces informations pour prédire pourquoi et si une personne reviendra ou non.
Conclusion
Les possibilités d'amélioration de votre entreprise sont infinies lorsque vos clients sont heureux de vous faire part de leurs commentaires. En analysant les commentaires des clientsLes entreprises peuvent ainsi mieux servir leurs objectifs et prendre des décisions plus adaptées, centrées sur le client.
Apprendre à analyser et à extraire des informations précieuses n'est pas un processus facile ; cependant, une fois maîtrisé, il peut bénéficier de manière significative à tous les aspects de l'entreprise.

