We are all aware that Instagram stories acquired the attention of every marketer in the world and managed to take over the stories format from Snapchat and TikTok.
According to the latest Instagram updates, the platform is evolving beyond the square photo format, and it’s placing a huge bet on the Instagram video formats. Users on both iPhone iOs and Android are able to use innovative features to make boomerangs, hands-free selfies, repost or just view stories of their favorite influencers.
In this relation, we have interesting Instagram Stories stats to prove why this social media format should be included in your marketing strategy.
Here you will find useful statistics and insights, starting from general data about the overall usage of Instagram stories to real case studies that give evidence about the performance of the Instagram story ads.
- General Instagram Stories Statistics
- How to View Instagram Stories Analytics?
- What Instagram Story Metrics Should You Watch Out For?
- How to Analyze Instagram Stories Data?
- How to aggregate and store Instagram Stories Data?
- Instagram Story Ads Analytics
- Bonus: Instagram Stories Tools For Better Results
- How to Optimize Your Marketing Strategy Based on Instagram Stories Analytics: Practical Examples
- FAQ About Instagram Story Analytics
- Conclusion
FYI: You can embed Instagram stories widget automatically on your website and display your Instagram stories in seconds. Try it now.

Display Instagram stories on your website automatically
Automatically generate and embed Instagram stories to unlock your website’s sales potential.
General Instagram Stories Statistics
These are official statistics published by the Instagram team about the vast usage and adoption of Instagram stories not just from regular users, but also by Instagram businesses from all over the world.
We’ve outlined these 5 data points to understand the power of Instagram stories and why this format is gaining so much traction.
So, here are the main stats showing how many people use Instagram stories and how popular this format is:
- Instagram stories are used by 500 million users every day (Instagram internal data, January 2019)
- One-third (1/3) of the most viewed Instagram Stories are from businesses
- 50% of businesses on Instagram worldwide created at least one story during a typical month
- 96% of US marketers surveyed plan to continue using Stories ads in the next 6 months
And if this format is compared to the current, most popular format, such as Facebook and the Instagram feed, there is a viable prediction that sharing with Instagram stories will surpass sharing through Feed views.

Huge, right?
Other tech giants are also following the trends with the recent launches of LinkedIn Stories and Google Stories.
Well, let’s see if this strong number can really impact your usage of the stories and if you can get some of the results that this format is promising.
How to View Instagram Stories Analytics?
In the previous section, we’ve seen that Instagram stories are generally enduring format. But in order to see this for ourselves, we need to start monitoring Instagram insights for our own stories.
In the following text, we have Instagram story insights explained.
Similar to the analytics section for your account and Instagram posts, your story analytics and story insights can be found in the top right corner of your Instagram business profile by tapping the “Insights” button.
If you still have not seen the Insights section in your Instagram account, here are the steps on how to access them.
Please note: before you start looking for the Insights section, make sure your Instagram profile is converted to a business profile by connecting your Instagram account with your official Facebook business page. Once you do this, you will get the Insights option in your Instagram profile.
There are a few ways how you can view your stories’ statistics, depending on if you want to view the insights for the current/live story or if you want to check historical data about the previous stories.
To access the Instagram stories of the active story, follow these steps:
- First, create an IG story with a tap on your profile icon
- Choose an existing photo from the camera roll or take a photo with a tap on the camera icon
- Choose an emoji and post the story with a tap on the bottom right
- After few minutes or hours, tap again on the current story
- Swipe up the story you are viewing
- It will open a bottom drawer view with the story insights
- Tap the (eye) icon to view the actual Instagram users who have viewed the story
- Tap the (chart) icon to view the insights for the story
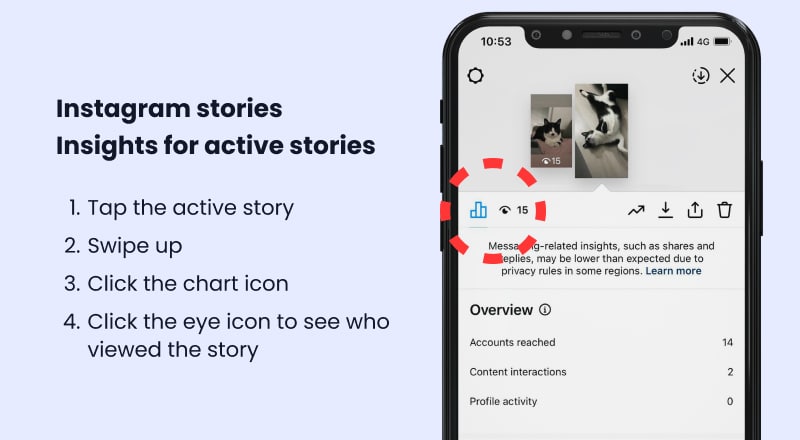
If you want to access the insights for Instagram Highlights, the above steps are the same. Just go to your profile and tap on a Highlight, swipe up, and tap the chart icon explained before.
To view Instagram stories analytics and insights for all your previous stories, follow these steps:
- Go to your profile
- Tap the top right (menu) icon
- Tap the Insights menu item
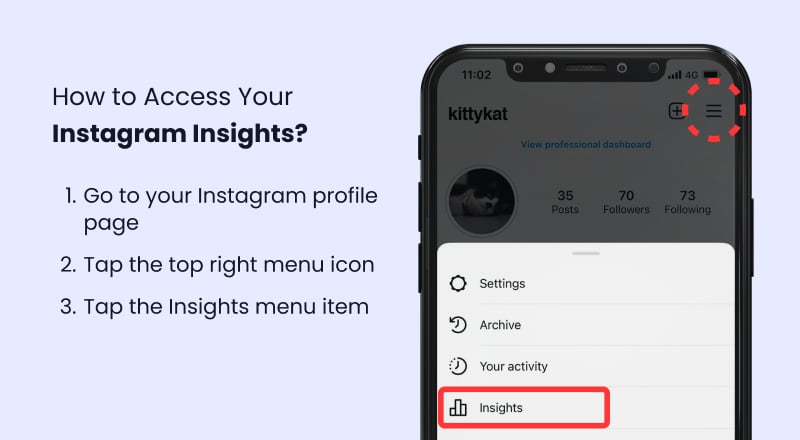
Next, you can see how to access the historical data about all your stories.
Just follow these steps:
- In the Insights screen, tap on the Content menu
- Scroll down to the Stories section
- Tap the See All > link
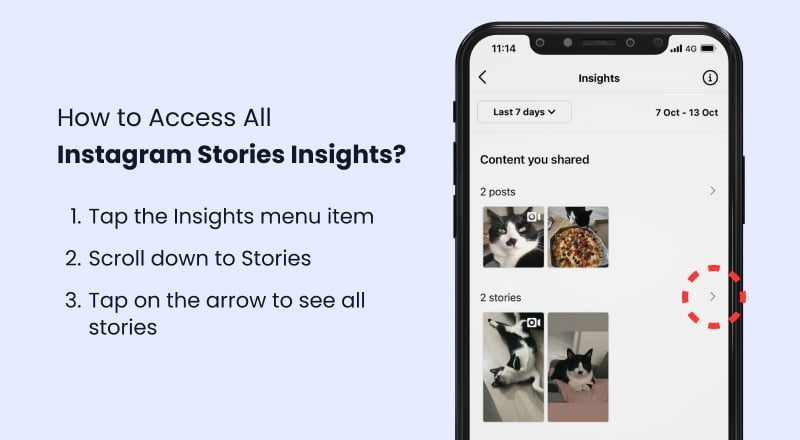
In this section, you are able to view insights for each particular story. You will notice that in the layout, the stories are organized based on the slides and a metric is displayed in the bottom middle.
Each metric can be changed by clicking on the top metric blue word that is selected at the moment. Here is how to do this.
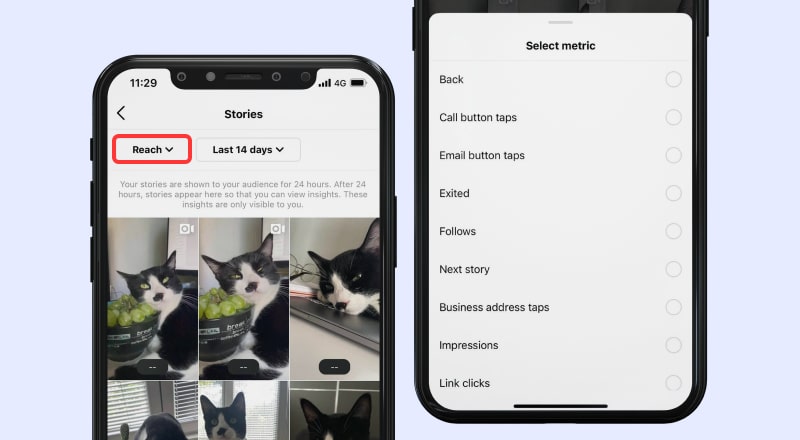
What Instagram Story Metrics Should You Watch Out For?
Once you access your Instagram stories insights, you will see some specific data items that are very unique to the story format. In order to understand their meaning and how Instagram measure them, please check the official Instagram stories insights definition for the most common Instagram story metrics:
- Impressions: This metric refers to the total number of times users have viewed your story. By tracking impressions, you can measure the reach of your content and identify the posts that resonate with your audience.
- Reach: Unlike impressions, reach only counts unique users who have viewed your story. This metric helps you understand how effectively your content is expanding your audience and allows you to compare the performance of different stories.
- Engagement Rate: To measure the level of interaction your stories receive, look at the engagement rate. This metric takes into account actions like replies, sticker taps, and swipe-ups and is calculated as the total engagements divided by the number of unique views. A high engagement rate indicates that your content is driving interactions and grabbing your audience’s attention.
- Exits: Keep an eye on the number of users who exit your story before it finishes. A high exit rate may indicate that your content is not resonating with viewers, prompting them to leave before completion. Use this metric to identify patterns and adjust your content strategy accordingly.
- Taps Forward: This metric tracks the number of times users tap to skip to the next story. A high number of taps forward might signal that your content is not engaging enough or too lengthy. Experiment with different formats and lengths to find what works best for your audience.
- Taps Backward: Conversely, taps backward count the number of times users taps to rewatch the previous story. This can be a positive indicator, as it shows that your content was engaging enough for users to want to see it again.
- Completion Rate: This metric measures the percentage of users who watch your entire story from start to finish. A high completion rate suggests that your content is engaging and holds the viewer’s attention throughout the entire story.
- Sticker Interactions: Instagram Stories offer a variety of interactive stickers such as polls, questions, and quizzes. Monitor each sticker type’s engagement and response rate to understand which interactive elements work best for your content.
In the preview of the story insights, you will also see a section with Interactions that might include the following data points: Replies, Website clicks, and Profile visits.
Another one worth mentioning here is the Sticker Taps, which shows the number of times people have tapped on a hashtag, location tag, mention, or product sticker on your Story.
It is good to know that Instagram shows this data from the moment you’ve converted your personal to a business account. So for any previous stories, you will not be able to view Instagram story analytics.
How to Measure Discovery Metrics in Instagram Stories Analytics?
Discovery metrics in Instagram Stories Analytics provide insights into how your content is being discovered and viewed by your audience. To access these metrics, follow these steps:
- Open your Instagram profile and tap the hamburger menu in the top right corner.
- Select “Insights” from the menu.
- Navigate to the “Content you shared” tab and choose “Stories.”
- Open a story you like to analyze and check the Overview, Engagement and Reach sections to view metrics such as Impressions, Reach, and Follows.
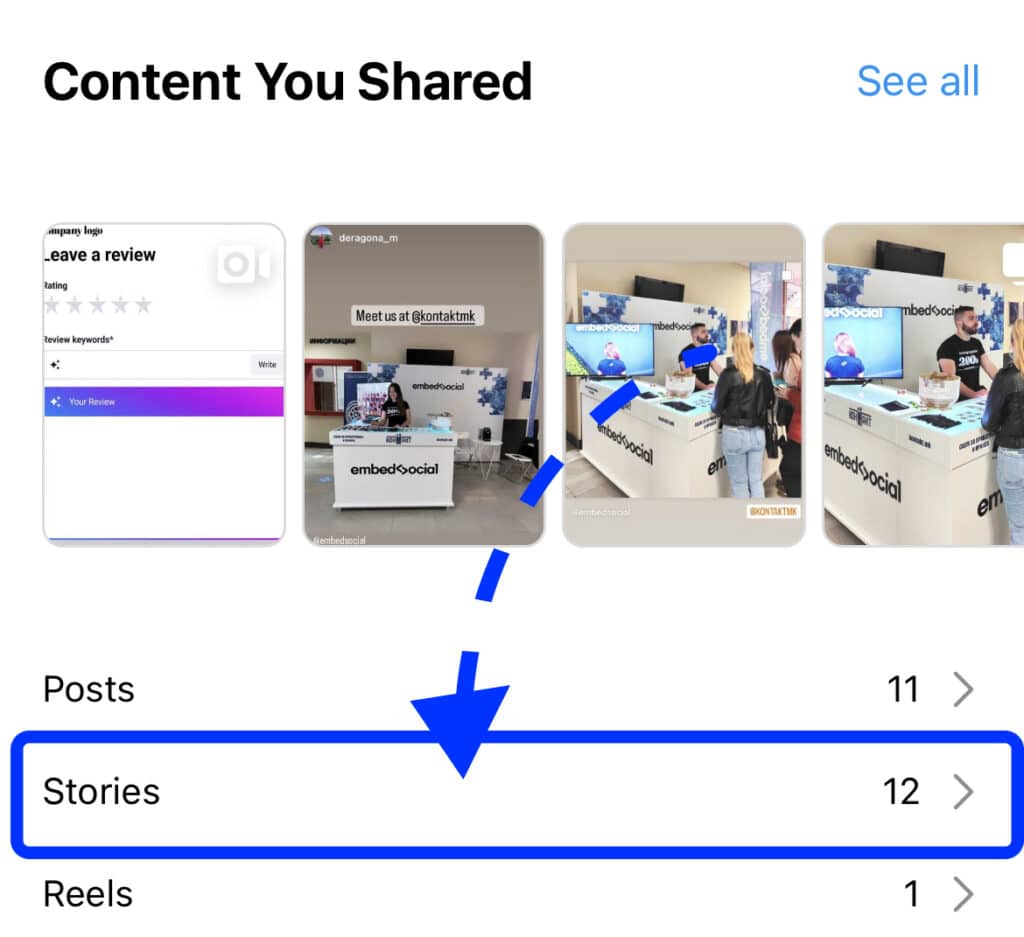
By analyzing discovery metrics, you can gauge the visibility and effectiveness of your content in reaching new audiences.
How to Measure Navigation Metrics in Instagram Stories Analytics?
Navigation metrics help you understand how your audience interacts with your stories, including skipping, rewinding, or exiting. To measure these metrics, follow the steps below:
- Access your Instagram profile’s Insights following the steps above.
- Navigate to the “Content you shared” tab and select “Stories.”
- Scroll down to the “Navigation” section to view metrics like Taps Forward, Taps Backward, and Exits.
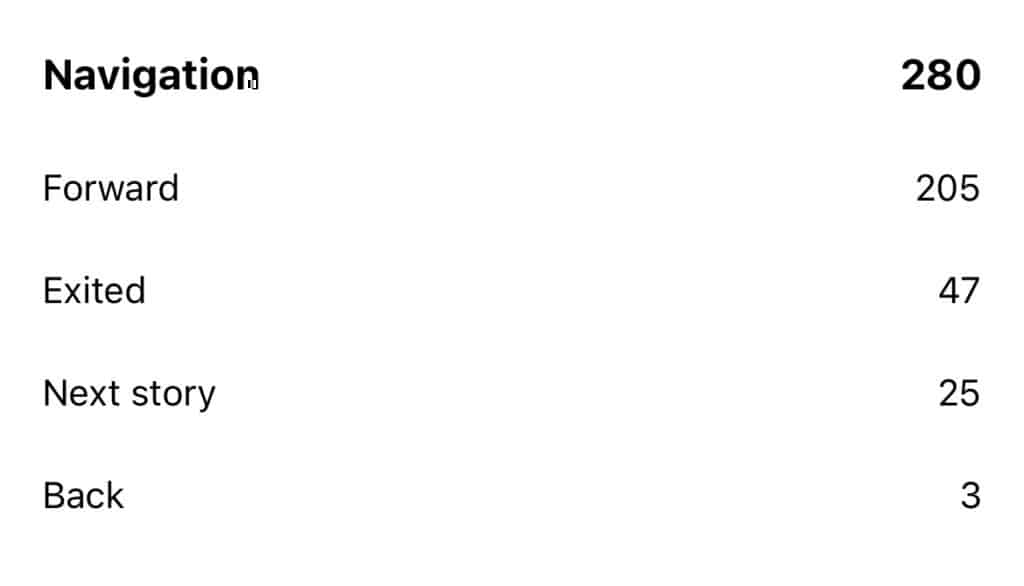
Use this data to identify patterns in audience behavior and optimize your content for better engagement and retention.
How to Measure Hashtag and Location Sticker Performance on Instagram Stories?
To measure the performance of hashtag and location stickers in your Instagram Stories, follow these steps:
- Access your Instagram profile’s Insights following the steps above.
- Navigate to the “Content you shared” tab and select “Stories.”
- Choose an individual story that includes a hashtag or location sticker.
- View the “Sticker Taps” metric to see how many users interacted with the sticker.
Keep track of the performance of different stickers to identify which ones drive the most engagement and use them strategically in your future stories.
How to Measure Interaction Metrics in Instagram Stories Analytics?
Interaction metrics provide insight into how your audience engages with your stories, including replies, sticker taps, and swipe-ups. To measure these metrics, follow the steps below:
- Access your Instagram profile’s Insights following the steps above.
- Navigate to the “Content” tab and select “Stories.”
- Scroll down to the “Interactions” section to view metrics such as Replies, Sticker Taps, and Swipe-ups.
Use these insights to understand which types of content and interactive elements encourage more audience engagement and incorporate them into your Instagram Stories strategy.
New Instagram Stories metrics
Instagram is constantly rolling out new features and related metrics.
Some of the newest metrics in Instagram story analytics are: Directions, Calls, Texts, and Emails – which are related to the effect that Instagram stories had on the action performed on your profile CTA buttons.
How to Analyze Instagram Stories Data?
In the following text, we will show you a few tips on how to analyze the metrics of your Instagram stories and will answer some common questions that you might have about the stories’ data you will see in your account.
What is the Difference Between Reach & Impressions in Instagram Stories Analytics?
The difference comes from the fact that a single person can view your story multiple times. So if they view the story 5 times, you will get 5 more impressions.
And when it comes to the reach metric, it represents the number of unique people who viewed the story regarding the number of times they viewed it.
What is better, taps back or taps forward?
In short, taps backward. Why? Well, if people tap more backward, that can signal that they have viewed more of your story, which is interesting, so they go back and spend more time on it.
Taps forward can signal that maybe some parts of the story slide are boring or not giving enough information so people want to jump straight to the end in order to get the idea of the story.
But please note that on the slides where you have arrows or explicit call to action to navigate further, the taps forward can be increasingly high if compared with other slides. So that will be an expected result of the action you want the story slide to achieve.
How are Exits calculated?
By definition, exits occur when a person leaves your story. This does not mean that they went back or tapped forward. This means that they:
- Tapped the x icon
- Swiped to the next story of another account
- Closed the Instagram app
- Swiped down to their feed.
So the conclusion is that your primary goal of the story is to have a lower percentage of the exits when compared with the reach.
How to measure clicks and CTRs to my website?
To measure click-through rates or the number of clicks coming from the stories to your website, you can include a UTM type of link for your ‘See more’ button.
In order to track Instagram stories and measure the Instagram stories’ performance more precisely, you can follow the number of clicks coming to your website in Google Analytics.
In many cases, this See more button is still not available, so if you do not have this option you can try adding @ mention to lead directly to your profile, where you can add the UTM link in the bio section.
FYI: You can embed Instagram stories widget automatically on your website and display your Instagram stories in seconds. Try it now.
How to aggregate and store Instagram Stories Data?
If you ever had the chance to analyze the success of your organic Instagram stories, you will conclude that the current Insights section described above is created for smaller users or business accounts who probably do not need to programmatically analyze the success of their stories.
But, if you want a professional approach in the Instagram stories insights analysis, you will need a third-party tool or software to help you do more with your stories data.
The Instagram story viewer platform, EmbedStories tackles this issue and addresses the problem through a variety of functionalities that can help to analyze stories’ data at a larger scale.
Here are a few features that EmbedStories provides:
- Generate stories and their Instagram data points automatically
- Collect and store this data in one place with easily accessible functions
- Options to embed the stories on any website
- Unique data points for the success of your stories on your website
- Boost Instagram Stories into Ads
Here is an example of Instagram stories widget embedded in this blog post, using the EmbedStories platform:
Here is a screenshot in a comparison mode for the insights into the generated stories in the EmbedStories system:
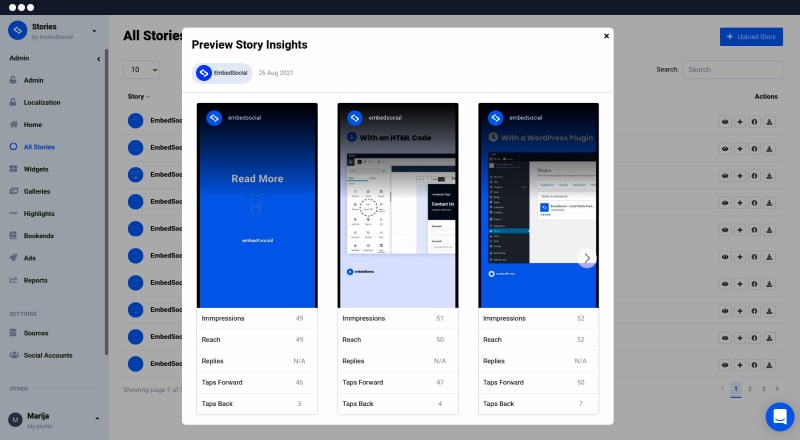
Regarding the Instagram analytics of the stories embedded on your website, here is a sample view of the report about the performance of a story beyond Instagram:
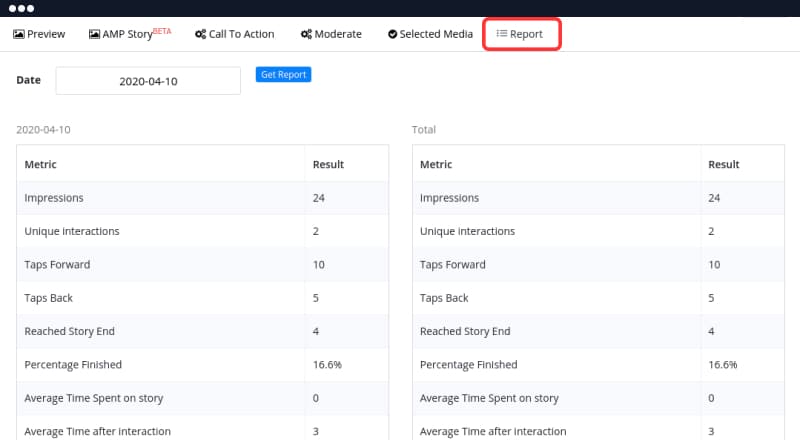
For more details about Insta stories analytics in EmbedStories, check the analytics tutorials.
Instagram Story Ads Analytics
When it comes to using the Stories format to create and boost sponsored ads, the results that most of companies are getting are pretty awesome.
This vertical, mobile format seems to respond more to the user’s behavior, so having a native ad that can engage with them on a full screen makes total sense to drive great results.
We’ve analyzed a few success stories that Instagram publishes on their official business page, and based on this survey, we’ve come to the following common statistics that can be expected if you run Instagram stories ads:
- More purchases with ads in Stories compared to feed
- Lower cost per acquisition with ads in Stories compared to feed
- Larger % of prospecting purchases attributable to ads in Instagram Stories
- Increased lift in ad recall and overall awareness
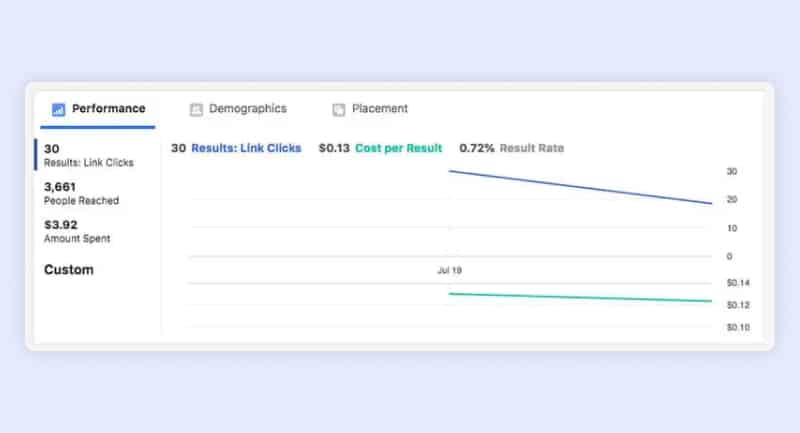
Additionally, one important metric that marketers usually define for their Instagram marketing objectives is to increase website clicks the Link Clicks metric.
This comes from the common practice of creating Instagram story ads to get the CTA option that allows you to add a custom link in the story. This is the main use case for Instagram accounts that still do not have the option to add links to their organic stories.
Here are other Instagram Story Ads metrics you will need to monitor:
- Results: Link Clicks
- Cost per Result
- Result Rate
- Result Rate
- Unique link clicks
- Landing page views
- Relevance score
To access the insights of the Instagram story ads, you must go to your Facebook Ads Manager account and view the Chart data for the Instagram story ad. The main report that you will need to monitor looks like the sample below:
Bonus: Instagram Stories Tools For Better Results
As we all know, Instagram Stories is a great way to share the little moments in life with your followers. And now you don’t have to invest thousands of dollars in design firms or software just for this purpose- there are plenty of free tools available for your Instagram content to bring you a number of views and engagement.
Here’s a list of the tools you should consider to boost the performance of Insta stories:
1. Stories IG maker – Canva is a popular tool when it comes to creating high-quality social media content, especially Instagram posts and stories. There are many templates you can use, and with their easy drag-and-drop editor, you can go beyond creativity. You can add stickers, imagery, and anything that may amaze Instagram users.
2. Instagram stories animator – You can use Boomerang to create unexpected Instagram videos for your stories. Instagram itself has this animation, but this tool offers you to create videos more creatively and not only for your Insta stories and Instagram Reels but also for stories on other platforms as Snapchat, TikTok, or even WhatsApp.
3. Instagram stories scheduler – Well, you do not always you’ll have the time to post stories manually on your profile page. Buffer is a great tool that helps you schedule your stories in advance and punctually publish them on your Instagram profile. It’s a very popular tool between influencers, businesses, and creators.
4. Insta stories generator – EmbedStories is the right tool if you want to expand the reach of your stories beyond Instagram. It allows you to create a widget of your Insta stories and display them on your website. It integrates with the Instagram algorithm, allowing you to bring your Instagram account to your website. Moreover, you can also mimic story highlights. Now, your subscribers can watch Instagram stories on your website!
5. Insta hashtag generator – What’s an Instagram app without hashtags? Hashtag For Likes is the tool that will help you enlarge that Instagram viewer list. Depending on your Instagram marketing goal, this generator will bring up easy, medium, and hard hashtags in chronological order. Whatever ones you choose to use it’s up to you.
6. Instagram story viewer – Stories disappear in 24 hours, but you can still archive them so your followers can still view Instagram stories later on. You can use the native Instagram options to archive and download Instagram stories, but you can level up and save the best stories in a web-based app as EmbedStories.
How to Optimize Your Marketing Strategy Based on Instagram Stories Analytics: Practical Examples
Leveraging Instagram Stories Analytics can significantly improve your marketing strategy and boost audience engagement. Here are some practical examples to optimize your approach based on the insights you gather:
Identify your best-performing content
If your behind-the-scenes content consistently receives higher impressions and engagement rates, create more of this type of content to connect with your audience on a personal level.
Optimize story format and length
If you notice higher exit rates on longer stories or those with a specific format, try breaking the content into shorter, more digestible segments or experimenting with different formats, such as video clips or images with overlaid text.
Experiment with interactive elements
If your audience engages more with polls than with quizzes, use more polls in your stories to encourage interaction.
For example, ask your audience to vote on their favorite product features or color options.
Analyze hashtag and location sticker performance
If your stories with specific hashtags or location stickers receive more sticker taps, use them strategically to increase visibility.
For example, include popular industry-related hashtags or tag your store’s location to attract local followers.
Post at optimal times
If your analytics show higher engagement rates during weekdays at 7 PM, schedule your stories to go live during that time to maximize visibility and audience interaction.
Monitor audience demographics
If your primary audience is female and aged 25-34, create content that appeals to their interests and needs.
For example, if you’re a fashion brand, showcase trendy styles and offer outfit inspiration tailored to that demographic.
Leverage user-generated content
Repost content from satisfied customers showcasing your product in use, like a customer wearing your clothing brand on a night out, or a user demonstrating the results of your skincare products. This can help build trust and credibility with your audience.
Track and measure your goals
If your objective is to increase website traffic, monitor the number of swipe-ups on stories featuring product promotions or blog post teasers. If the results are below your target, adjust your strategy by refining your calls-to-action or offering exclusive content for Instagram followers.
By implementing these practical tips with real-life examples and regularly reviewing your Instagram Stories Analytics, you can continually refine your marketing strategy, create more impactful content, and foster stronger connections with your audience.
FAQ About Instagram Story Analytics
Well, Snapchat was the first social media platform that implemented this feature. But no matter if you’ve ever used that app or not, Instagram stories are very easy to view.
IG stories use the same interface on both iOs and Android, so it doesn’t matter if you use iPhone or any other smartphone.
Just open your Instagram app, and on the top of the screen, you’ll see a series of mini-profile pictures highlighted in circles. Those are the stories actually. Tap the first one (or anyone you want to view), and that’s it.
If you want to view all photos and videos within the same Story, just tap on the screen and they will change.
And if you want to go from one Story to another, just swipe right, and you’ll see the next user’s Story.
Note: If you don’t do any action on the screen while watching stories, they will automatically swipe from one to photo/video within the same story. And right after that, the next user’s story will be opened. So, you can view stories hands-free. Cool, right?
Since Insta Stories are becoming as popular as Instagram posts, as a business, you should consider including them in your social media marketing strategy.
IG stories are a cool feature that allows Instagram users to share a temporary story with their followers, in a highly immersive format.
To create an IG Story tap on your profile picture in the top left corner at the top of your screen. You can take photos and videos directly from the app (by tapping the camera icon) or you can upload them from your camera roll.
After you decide on your story, you can adjust it in any way you like. For example, you can take a boomerang video, insert a selfie as an image overlay, display it on full-screen, or resize the creative. Just swipe left of the screen to view more layout options.
To make the story more engaging and appealing, there are many decorations and functionalities you can add to your story, like stickers, gifs (giphy), hashtags, emojis, use different fonts, question stickers, hashtag stickers, poll stickers, add links, and you can also tag people.
Also, there’s another cool feature called Instagram Story Highlights that allows you to keep your favorite stories on your account for more than 24 hours. Highlights are permanently on your profile and can be updated at any time.
Now let’s see how an Instagram Story looks like and what are its elements.
First of all, the body of the Story is the picture or the video that represents the ephemeral content.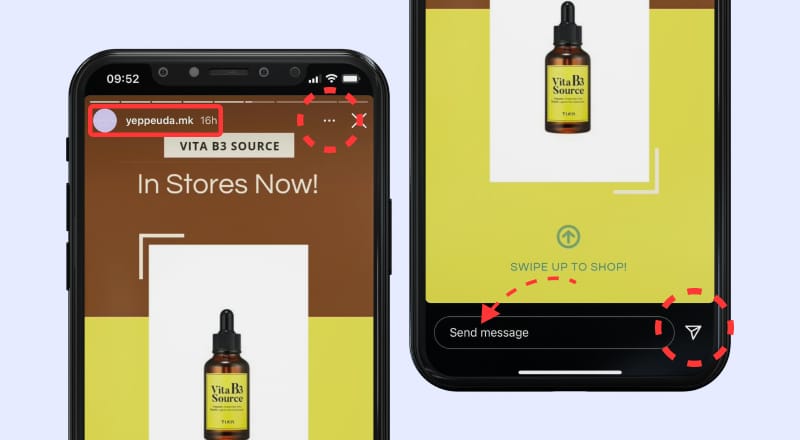
In the top left corner is always the profile photo and the username of the Story owner. Previously, if it was a verified account (like a business account or famous influencer), next to the username, a verification icon was standing, but that’s not the case anymore. So, all the stories in this part look the same.
On the top right corner, there are three dots that yellow you to report the story, copy the story link, share it, or mute the stories from that user.
At the bottom left, there is a reply bar that you can tap to send a direct message from the Story. And right next to it there is a share arrow.
If you want to share the story in a private message with another user, tap the arrow, choose the Instagram user you want to send the story to and click ‘Sеnd’.
A really cool option is the Story Reactions. If you swipe up the bottom of the screen, a few emojis will pop up. You can choose one and tap on it to let know the Story owner how you feel about their Story without typing anything.
Lately, Instagram is pushing a new feature called Link Sticker that is available in the stories stickers library and is the new solution for adding links on the Instagram story.
Conclusion
Instagram stories are the most native format that has proven to provide great results for digital marketers, and many businesses are already incorporating them as a vital part of their content strategy.
By understanding the Instagram algorithm and with the right content and constant improvement in the visual designs by using gifs, video, or various story templates, you can achieve great results. We’ve seen that there are lots of unique Instagram Stories analytics, that need to be monitored and analyzed in order to improve every future campaign that will include both organic or sponsored Instagram stories.
FYI: You can embed Instagram stories widget automatically on your website and display your Instagram stories in seconds. Try it now.

