Clients rarely cancel because the work was bad. They cancel because they can’t see what the work did.
The monthly report is where they see it. It turns “we posted 24 times” into “mentions grew 18%, sentiment held at 71% positive, and the reviews carousel on your menu page drove 316 clicks.” Send it late, or fill it with follower counts and nothing else, and your retainer starts to look like a cost.
This social media report template gives you that report in eight sections: executive summary, owned channels, mentions, who’s talking, content mix and sentiment, reviews, website widget performance and next steps. Copy it from this page with one click, no download and no form, and paste it into Google Docs, Slides, Word or Notion.
Then fill it by hand, or let Claude or ChatGPT fill it from your EmbedSocial data with the prompt further down.
Free social media report template
Click Copy template, paste it into the tool your client reads reports in, and save it once per client. It works as a social media reporting template for any client and any network. Every [bracketed] spot is a number or a sentence to fill in.
SOCIAL MEDIA REPORT: [Client name] | [Month YYYY]
Prepared by: [Agency name]
Reporting period: [1 Month YYYY] to [30 Month YYYY] | Compared with: [previous month]

1. EXECUTIVE SUMMARY
- Headline numbers: [metric: value, +0% vs last month] | [metric: value, +0%] | [metric: value, +0%]
- Wins: [win 1, with the number] | [win 2, with the number] | [win 3, with the number]
- Watch-out: [one trend to keep an eye on, and why]
- Ask: [one decision or approval you need from the client]

2. OWNED CHANNELS (source: native analytics of each network)
Network | Followers | Change | Reach | Engagement rate
[Instagram] | [0] | [+0%] | [0] | [0.0%]
[TikTok] | [0] | [+0%] | [0] | [0.0%]
[LinkedIn] | [0] | [+0%] | [0] | [0.0%]
- Best post on owned channels: [link] | [why it worked]

3. MENTIONS OVERVIEW (source: EmbedSocial Social Insights)
- Total posts collected: [0] ([+0%] vs last month)
- Unique authors: [0] ([+0%] vs last month)
- Post timeline: [busiest day or week, and what caused the spike]
- Top collected posts: [link 1] | [link 2] | [link 3]

4. WHO'S TALKING (source: EmbedSocial Social Insights)
- Top authors: [@author: 0 posts] | [@author: 0] | [@author: 0] | [@author: 0] | [@author: 0]
- Popular hashtags: [#hashtag: 0 posts, 0%] | [#hashtag] | [#hashtag] | [#hashtag] | [#hashtag]
- Most used keywords: [keyword] | [keyword] | [keyword] | [keyword] | [keyword]
- Creators to approach: [@author, and why]

5. CONTENT MIX AND SENTIMENT (source: EmbedSocial Social Insights)
- Content by type: video [0%] | carousel [0%] | image [0%] | text [0%]
- Content by platform: [Instagram 0%] | [TikTok 0%] | [other 0%]
- Sentiment: positive [0%] | neutral [0%] | negative [0%] ([+0 pts] positive vs last month)
- What people praised: "[short quote]" ([@author])
- What people flagged: "[short quote]" ([@author])

6. REVIEWS (source: EmbedSocial review sources)
- New reviews: [0] | Average rating: [0.0] ([+0.0] vs last month)
- Praise themes: [theme 1] | [theme 2] | [theme 3]
- Complaint themes: [theme 1] | [theme 2] | [theme 3]
- Reviews rated 1 or 2 stars: [0] | Replied to: [0]
- Review of the month: "[quote]" ([name], [source])

7. WEBSITE WIDGET PERFORMANCE (source: EmbedSocial Analytics)
- Views: [0] ([+0%]) | Interactions: [0] ([+0%]) | Link clicks: [0] ([+0%]) | Engaged visit rate: [0%]
- Top widget: [widget name] on [page URL]: [0] views, [0%] engaged visit rate
- Top post in a widget: [post or review]: [0] clicks

8. NEXT STEPS
1. [Action] | Based on: [the number that justifies it] | Owner: [agency or client] | Due: [date]
2. [Action] | Based on: [number] | Owner: [ ] | Due: [date]
3. [Action] | Based on: [number] | Owner: [ ] | Due: [date]
Next report: [date]

9. DEFINITIONS AND SOURCES
- Engagement rate: engagements divided by reach for the period (native analytics)
- Posts collected: posts that mention or tag [Client], or use its tracked hashtags or keywords (EmbedSocial Social Insights)
- Sentiment: share of collected posts rated positive, neutral or negative (EmbedSocial Social Insights)
- Views: times a page with the widget was loaded (EmbedSocial Analytics)
- Engaged visit rate: share of views with at least one interaction (EmbedSocial Analytics)
Here’s how four of those sections look as slides, with example data for a fictional coffee shop:

Most free templates, including most social media analytics report templates, stop at followers, reach and engagement. This one keeps those (section 2) and adds the four things agencies usually leave out: what people post about the client, who’s posting it, what customers write in reviews, and what the social proof on the client’s website does. That’s the work clients don’t see in Instagram Insights, so it’s the work they forget to credit you for.
What is a social media report?
A social media report is a summary of how a brand performed on social media over a set period, with what to do next. Agencies usually send one monthly per client, plus shorter campaign reports when a launch or contest ends.
Whether you call it a monthly social media report or a social media monthly report template, a good one answers three questions in order: what happened, why it happened, and what we’ll do about it. Everything in the template maps to one of those.
What to include in a monthly social media report
Executive summary
Write this section last. It’s three headline numbers, three wins, one watch-out and one ask. If the client reads nothing else, they should still know if the month went well and what you need from them.
Owned channel KPIs
These are the client’s own profiles: followers, reach and engagement rate per network, compared with last month. Keep it to one table. Our Instagram engagement rate calculator helps if you report engagement the same way across clients.
Mentions and sentiment
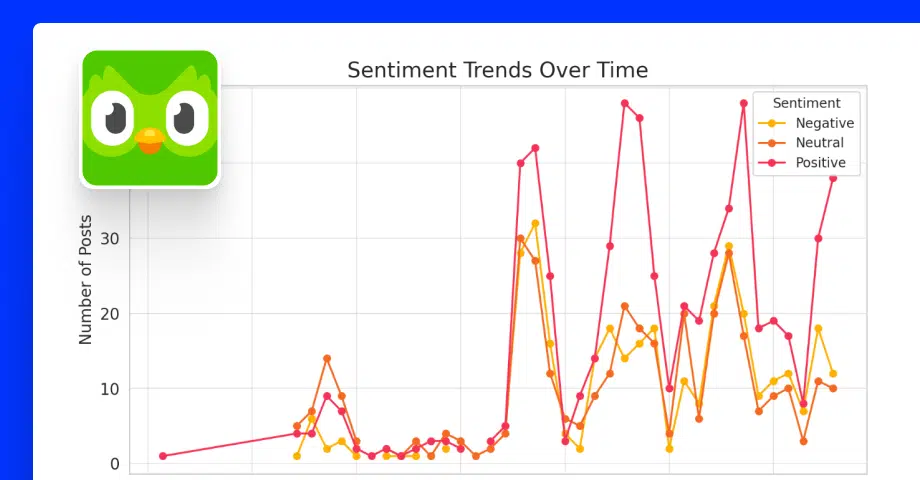
This is what people posted about the client when the client wasn’t posting. Report the number of posts collected, unique authors and the post timeline, then the split between positive, neutral and negative posts. Point out the busiest day and what caused it: a launch, a creator post or a complaint going around.
For the method behind the split, see how to analyze brand sentiment and our list of social listening metrics.
Top authors and hashtags
List the top authors, popular hashtags and most used keywords. Then add one line on what to do with them. The top authors are your shortlist of creators and ambassadors, and the keywords show how customers actually describe the product.
Reviews
Reviews are social proof the client already owns. Report new reviews, the average rating and the change against last month, then the top three praise and complaint themes and a review of the month.
Reply to the 1 and 2 star reviews before the report goes out. Our guide on how to respond to Google reviews has examples, and teams that manage Google Business Profiles can draft replies and review reports in Localith.
Website widget performance
This is the section most social media reports skip, and it’s the one that connects social to sales. If you embed a feed, a reviews widget or a UGC gallery on the client’s website, report:
-
Views: how many times a page with the widget loaded
-
Interactions: lightbox opens, post clicks and icon clicks combined
-
Link clicks: clicks on CTA buttons that take visitors to another page
-
Engaged visit rate: the share of views where the visitor interacted at least once
Add the top widget and the most-clicked post inside a widget. That post is a strong candidate for the client’s next ad. Need ideas for what to embed? See these social proof examples.
Next steps
End with three actions, each tied to a number in the report, with an owner and a due date. “Post more Reels” isn’t a next step. “Turn the two Reels with the most widget clicks into ads, owner: agency, due on the 10th” is.
How to fill out the social media report template
The template pulls from three places. Two of them are separate EmbedSocial features, so it helps to know which one answers which question.

Native analytics for owned channels
Followers, reach and engagement rate come from each network’s own analytics: Instagram Insights, LinkedIn page analytics, TikTok analytics and YouTube Studio. EmbedSocial doesn’t track the client’s own follower counts, so this is the one section you always fill from the networks. If you report Instagram Stories, our Instagram Stories analytics guide covers the metrics worth keeping.
Social Insights for mentions and sentiment
Social Insights analyzes the posts and reviews EmbedSocial collects for the client: mentions, tags, hashtags and keywords. It fills sections 3 to 5 of the template:
-
Total posts, unique authors and the post timeline for the mentions overview
-
Top authors, popular hashtags and most used keywords for who’s talking
-
Content by type, content by platform and sentiment analysis for content mix and sentiment
Filter by date range, media type, post type or social account, then use Download report to export what you see. The Social Insights guide explains every chart. New to the concept? Start with what social insights are.
Analytics for widget performance
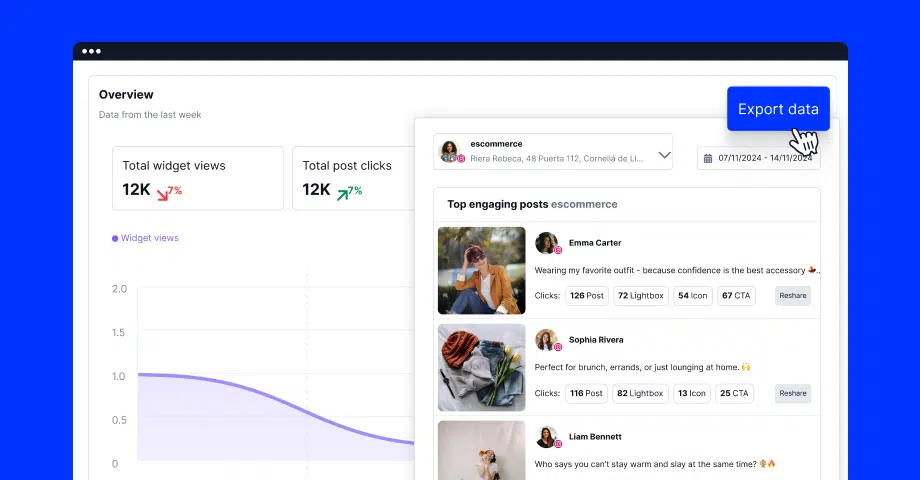
Analytics is a different feature. It measures the widgets on the client’s website, not social posts. Go to Widgets > Analytics for all widgets, or open a widget’s Analytics tab for one widget and export it as CSV. It shows views, interactions, link clicks, engaged visit rate, top widgets and top posts. Setup steps are in turn on widget analytics.
Note on dates: “Today” shows data up to the last full hour, and the 7-day, 30-day and longer ranges show data up to the end of yesterday. Pull the numbers on the 1st or later and last month is complete.
Fill the template with Claude or ChatGPT
The EmbedSocial MCP connects your EmbedSocial account to Claude or ChatGPT. It’s read-only and included on every EmbedSocial plan, including Free. Once it’s connected, the AI can read the client’s collected posts, reviews and widget clicks, and write the report sections for you.

Step 1: Create an account and connect the client’s sources
Create your EmbedSocial account, then connect the client’s sources: mentions, hashtags and keywords to track, review sources like Google, and the widgets on their website. Agencies can give each client its own sub-account, so reports never mix data.
Step 2: Add the EmbedSocial MCP to Claude or ChatGPT
Add https://embedsocial.com/admin/mcp as a connector and authorize it. See how it works in EmbedSocial for Claude and EmbedSocial for ChatGPT, or follow the step-by-step Claude MCP connector guide and ChatGPT MCP connector guide.
Step 3: Run the report prompt
Click Copy prompt, fill the brackets, paste the numbers the MCP can’t reach, and run it:
Using the EmbedSocial MCP, fill in my monthly social media report for [Client name] for [Month YYYY]. Compare everything with [previous month].

Pull from EmbedSocial:
1. Collected posts (mentions, tags, tracked hashtags and keywords): total posts, unique authors, the 5 top authors, the 5 most used hashtags, the 5 most used keywords, the split by content type and by platform, the busiest day, and the 3 top posts.
2. Sentiment: classify each collected post as positive, neutral or negative from its text, then give the split and one quote for praise and one for complaints.
3. Reviews: new reviews, average rating, change against last month, top 3 praise themes, top 3 complaint themes, and every review rated 1 or 2 stars.
4. Widgets: post clicks, icon clicks, lightbox opens and CTA clicks for each widget, and the most-clicked widget.

I'll paste the numbers the MCP can't reach:
- Owned channels (followers, reach, engagement rate per network): [paste]
- Widget views and engaged visit rate from EmbedSocial Analytics: [paste]

Write the report in this exact structure: 1. Executive summary, 2. Owned channels, 3. Mentions overview, 4. Who's talking, 5. Content mix and sentiment, 6. Reviews, 7. Website widget performance, 8. Next steps.

Rules:
- Use only data from the MCP or from what I pasted. If a number isn't available, write "not available". Never estimate.
- Show each number as this month, last month and % change.
- Keep each section under 80 words, for a client who reads it in two minutes.
- Write the executive summary last, and end with 3 next steps, each tied to a number in the report, with an owner and a due date.
Two parts of this prompt matter most:
-
“Never estimate.” Without it, an AI fills gaps with numbers that look right. One invented number in a client report costs more trust than a late report.
-
The pasted numbers. The MCP reads collected posts, reviews and widget clicks. It doesn’t read the client’s follower counts or widget views and engaged visit rate, so you paste those from native analytics and EmbedSocial Analytics.
The AI rates sentiment from each post’s text, so its split can differ a little from the Social Insights chart. If you need the exact chart, paste it from the Social Insights export instead.
Want slides instead of a document? Add “Turn this into a presentation with one slide per section” to the end. Here’s the same workflow on video, using brand mentions:
Step 4: Check every number and send
Compare each number with its source before the client sees it, add screenshots of the top posts, and send it. Save the prompt in a Claude project or a ChatGPT custom GPT so next month starts from the same instructions.
Reporting automations
Want a different format for some clients? These EmbedSocial automations come with their own prompts:
-
Build a monthly LinkedIn analytics report in Gamma: a 10-slide deck with posts, mentions, sentiment, widget clicks and recommendations.
-
Build monthly Instagram listening reports in Gamma: mention volume, top posts, sentiment, themes and next-month ideas.
-
Build monthly Google Reviews executive reports: rating trends, volume, and praise and complaint themes in a Google Doc.
-
Send weekly social proof report to Slack: a short weekly recap of widget performance between monthly reports.
Browse the rest in the social media reporting automations library. For platform setups, see our guides to Claude and ChatGPT for Instagram, for LinkedIn and for TikTok.
EmbedSocial features for social media reporting
Social Insights
EmbedSocial social listening collects posts that mention or tag the client, plus the hashtags and keywords you track, on networks like Instagram and TikTok. Social Insights turns them into total posts, unique authors, top authors, hashtags, keywords, content mix, sentiment and a post timeline. Setup guides: Instagram mentions, TikTok mentions, LinkedIn mentions and YouTube mentions.
Widget analytics
Widget analytics measures every feed, reviews widget and UGC gallery on the client’s website: views, interactions, link clicks, engaged visit rate, top widgets and top posts, with a CSV export per widget. Setup: turn on widget analytics.
Reviews
EmbedSocial reviews collects Google and other review sources in one place, and the Google reviews widget displays them on the client’s site. That covers both sides of the report: what customers wrote, and how those reviews performed on the website. For multi-location clients, see how to manage Google reviews for multiple locations.
MCP and automations
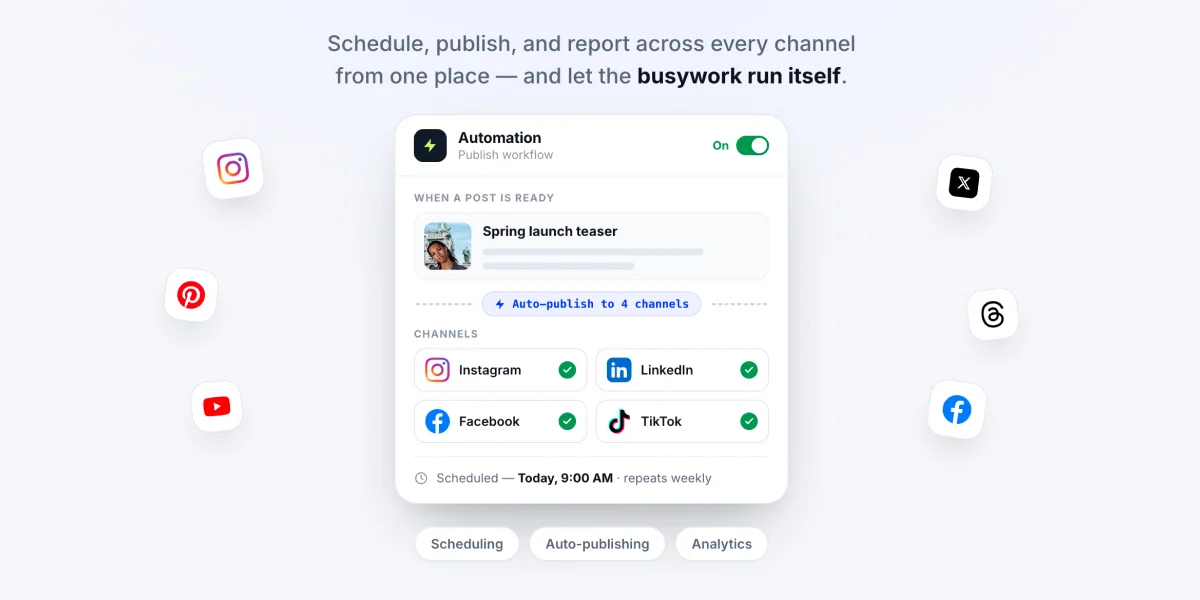
The EmbedSocial MCP and automations let Claude or ChatGPT read the data above and draft the report. There are platform-specific servers too: the Instagram MCP, TikTok MCP and YouTube MCP. New to MCP? Read our guide to social media MCP servers or how we use the EmbedSocial MCP in Claude.
Agency sub-accounts
EmbedSocial for agencies gives each client a sub-account with its own sources, widgets and permissions. The MCP reads one client at a time, so data never mixes between reports. It pairs well with a social media content library for clients.
Social media report examples
The template bends to different clients. Delete the sections that don’t apply instead of filling them with zeros.
Instagram report template
For an Instagram-only client, keep all eight sections and narrow the sources: Instagram Insights for owned channels, Instagram mention tracking for sections 3 to 5, and an Instagram feed widget for the website section. The Instagram listening report automation is already built for this version.
Multi-location business report
For restaurants, clinics and franchises, reviews carry the report. Move the Reviews section up to number two, add one row per location, and report the rating change per location. Our guide to online reviews reports covers location-level reporting.
E-commerce brand report
For online stores, the widget section carries the report. Report the social proof widget or shoppable gallery on product pages first, and use the top authors as your UGC pipeline. A social media aggregator keeps that content fresh without manual uploads.
Need a social media marketing report template that also covers ads or email? Add those as extra sections after section 7. Looking for a tool rather than a template? Compare the options in our roundup of social media monitoring tools.
Conclusion: Send the same report every month and let AI draft it
The report is the part of your service the client actually sees. Keep it in the same eight sections every month, tie every number to a decision, and end with three next steps.
The template gives you the structure. Social Insights and Analytics give you the numbers no other template asks for. The EmbedSocial MCP and the prompt above turn them into a first draft in minutes, so your time goes into the part only you can do: explaining what the numbers mean for the client.