Social Insights turns the posts your listening topics collect into charts: which hashtags carry the conversation, who posts the most, which platforms it happens on, and how people feel about it.
The page loads your data automatically. Open it and the charts are already populated from the filters at the top, so there is no import step and nothing to prepare first. It is the last stop in social listening setup: once your topic is collecting posts, this is where you read what came back.
Before you start, connect a hashtag, mention, or keyword source so there is something to report on. See Keywords, Hashtags and Mentions.
How to read your Social Insights
Open Insights. Click 'Social listening' in the left menu, then 'Insights'.
Set your filters. Pick a date range and adjust 'Time range', 'Media type', 'Post type', and 'Social accounts'. The charts redraw as you change them.
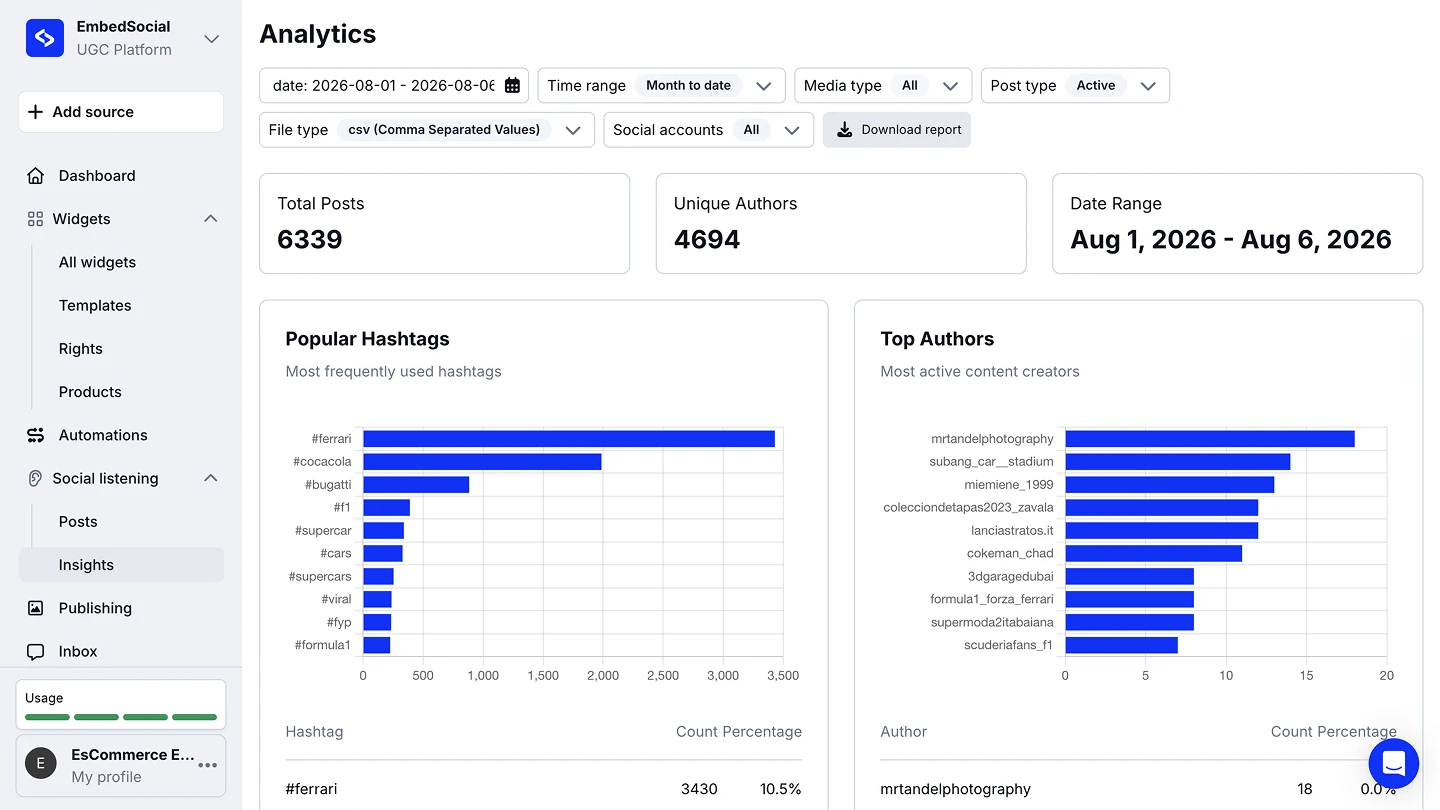
Read the summary tiles. 'Total Posts', 'Unique Authors', and 'Date Range' give you the size of the dataset before you read any chart.
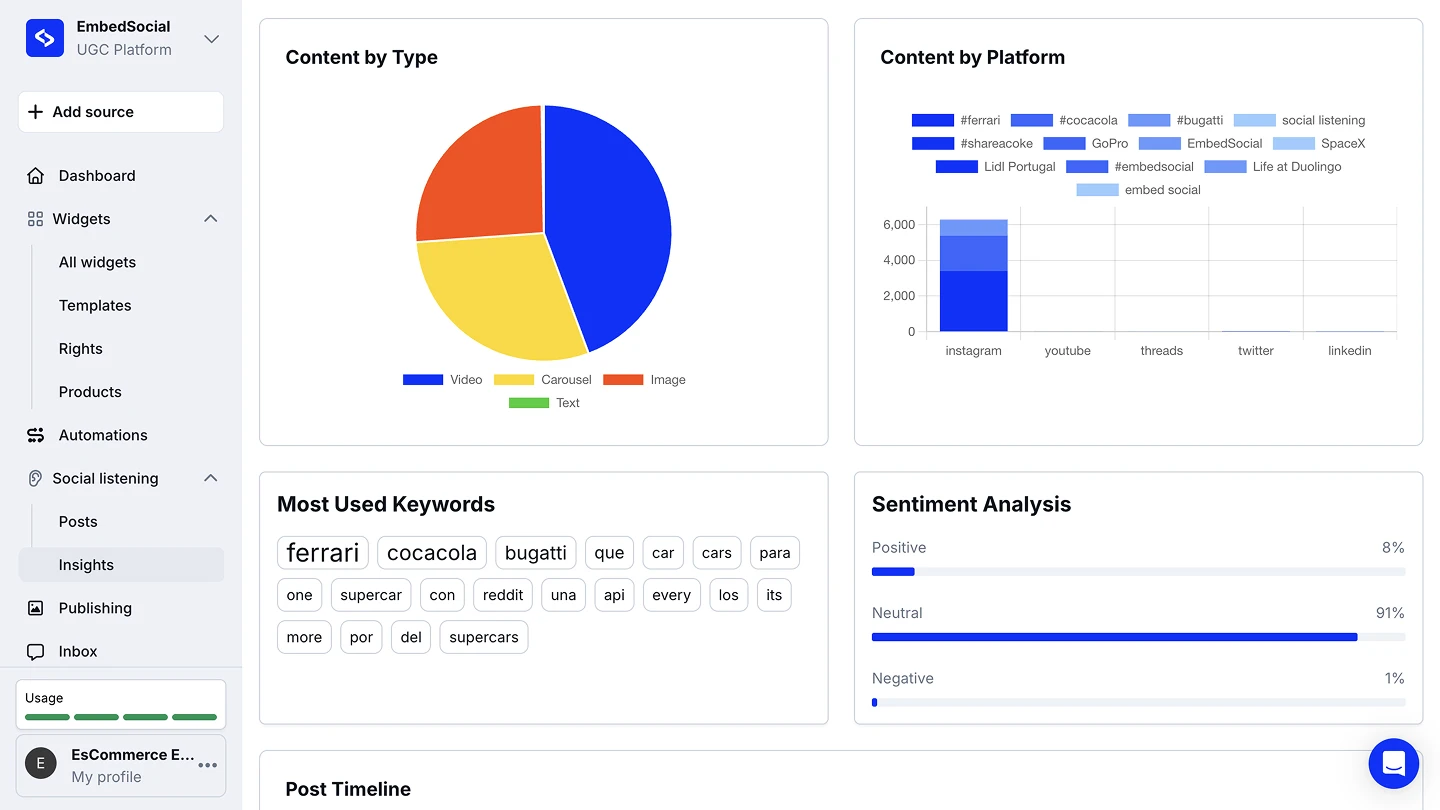
Work down the charts. Hashtags and authors sit at the top, then content breakdowns, keywords, and sentiment.
Download the report (optional). Choose a 'File type', then click 'Download report' to export the filtered data.


Every chart follows the filter bar. Narrow the date range or pick a single platform first, then read the charts, rather than reading everything at once.
What each panel tells you
- Popular Hashtags. The most frequently used hashtags, as a bar chart and a table with the count and percentage for each one. This is where you see which tag a campaign is actually running under.
- Top Authors. The most active content creators, with the same count and percentage breakdown. Useful for spotting the accounts worth reaching out to.
- Content by Type. How the posts split across video, carousel, image, and text.
- Content by Platform. How many posts came from each connected platform, stacked by the source or keyword that brought them in.
- Most Used Keywords. The words appearing most often across the collected posts, sized by frequency.
- Sentiment Analysis. The share of posts that read as positive, neutral, or negative.
- Post Timeline. How collection volume moved over the selected period.
Social listening and advanced analytics are available from the Pro plan. See what Social Insights can do and start your free trial.
FAQ
Do I need to import anything to see my data?
No. The page pulls your data automatically and shows the report for the selected filters as soon as it loads.
Why do the charts look empty?
Either the date range holds no collected posts, or your sources have not brought anything in yet. Widen the date range first, then check that your listening source is connected.
Can I export the data?
Yes. Pick a 'File type', then click 'Download report' to export exactly what your current filters show.
Which plan do I need?
Social listening and advanced analytics start on the Pro plan.
Does the sentiment score use AI?
Sentiment is calculated for you from the collected posts and shown as the positive, neutral, and negative split. You do not tag anything by hand.
What's next
Insights tells you what came in. To act on it, go back to 'Posts' and tag, moderate, or repost the content the charts point you at. See Keywords, Hashtags and Mentions.
If you have any questions, click the bottom right chat icon to talk with our customer success team or send us an email at support@embedsocial.com We're here for you 🙏